When I was an undergrad, I heard how Raymond Cattell (if memory serves me well) plastered his entire office, ceiling included, with papers on which he calculated the factor analysis involved in his theory of 16 basic personality traits. Hundreds of questionnaires with many items, maths to pull out the common variance and reduce the dimensionality of the data worked out, but nothing but pen and paper to do it on.
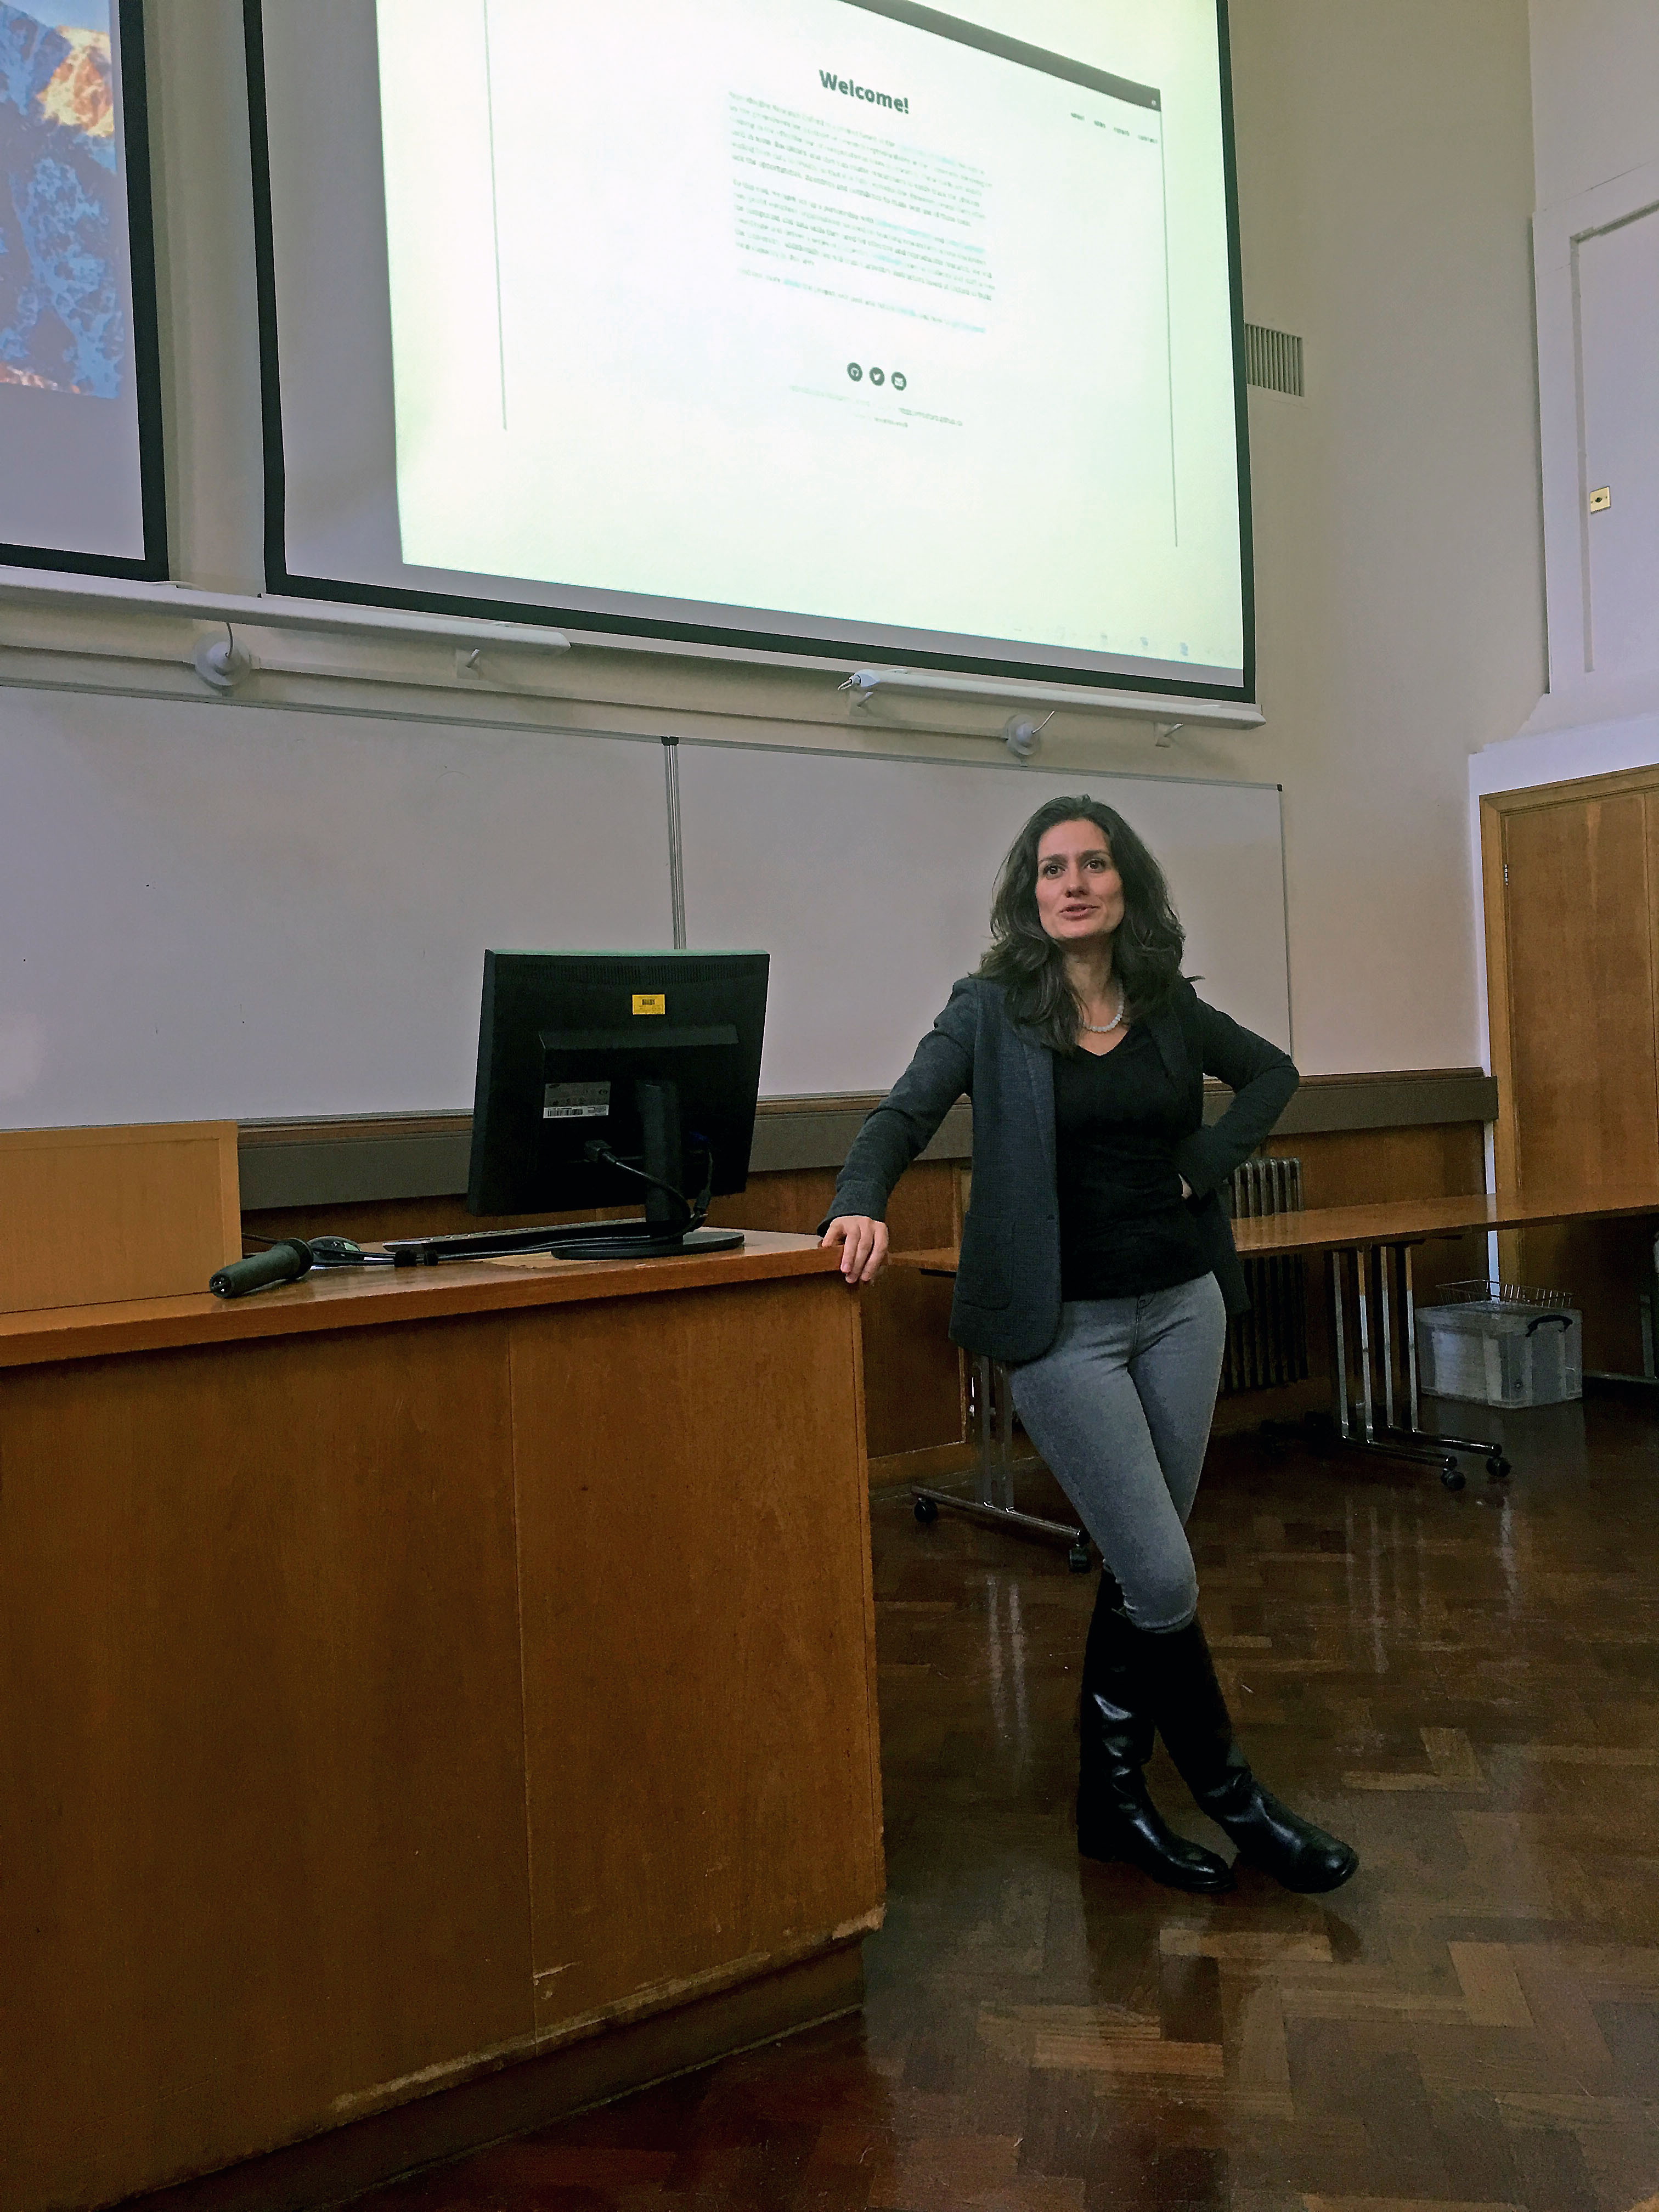
Nowadays when the data are typed in, it’s as simple as a series of clicks. But a series of clicks is not always wise, as Laura Fortunato explained to us in her talk, Effective computing for research reproducibility.
Nowadays, you start out with a data file. You might send it to a collaborator, who introduces some changes (perhaps imputes missing values, recodes some variables, etc). You get a different file back. Open it with SPSS, click through some options, get a result. Write the result down in a Word document. Think about your result further. Realize that the analysis can be fine-tuned. Introduce changes to your data file. Save it. Do a new analysis. Open your Word document, exchange the previous set of numbers for new ones. Send it to your collaborator, who tries out a few new ideas. Now you have a new data file, new sets of results, and a new series of boxes clicked in some drop-down menus along the way.
It’s impossible to keep track of all this.
A recent retraction of a 2005 Nature paper illustrates this well. The paper claimed to find a connection between bodily symmetry and perceived dancing ability: more symmetric individuals were rated as better dancers. This was an important finding, because it meant that people can pick up very subtle cues about bodily symmetry, which is known to be related to mating strategies, and is therefore an interesting evolutionary phenomenon. The media picked it up, and the study became famous. Except that Robert Trivers, the senior author on the study, started to doubt the veracity of the results. After an investigation was done by the various universities involved, it came to light that there were so many versions of the dataset that nobody knew which one was the original. So instead re-analysing the data, the group had to retract their Nature paper. And all it would have taken to save themselves from this major embarrassment is a file management strategy.
Laura decided that her lab would develop a more robust approach to data management and analysis. As she says in her talk, the moment your data are stored on a machine, the moment you use a computer, you’re a computational scientist and you need to take ownership of this process. So now, her lab has a set of procedures on what operating system to use, on how to share data repositories, files, and scripts with version control. She has code embedded in her papers, where the results become automatically updated if the analyses get changed along the way. That way, she is always sure the numbers she reports match the analysis she eventually selects.
How does one start with this? In her slides, you can find links to workshops she coordinates as part of the Reproducible Research Oxford project. This is based on a partnership between the University of Oxford and Software Carpentry and Data Carpentry. You can also find some examples of scripting in Unix (using materials from one of the Software Carpentry lessons). These workshops are free and open to all at the University.
Click here to take a look at the slides from Laura’s talk, and to download a few data files to explore using the code in the presentation. Inside you will find a lot of information on the workshops as well as the Reproducible Oxford project. What is this project, you might ask? Take a look and find out!
(This blog post is a preview of the themes in Laura Fortunato’s talk at the Oxford Reproducibility School, held on September 27, 2017. I occasionally use my own words to describe the contents, but the presented ideas do not deviate from the talk.)

